Showing posts with label Employment. Show all posts

Marginals

Once again, it's all about the marginals. Can Walmart absorb higher wages? Apparently they think they can. Yippee, great for their employees. Does that carry over throughout the entire economy? Nope. Nope. Nope.

http://www.cato.org/blog/reich-wrong-minimum-wage

Watching Robert Reich’s new video in which he endorses raising the minimum wage by $7.75 per hour – to $15 per hour – is painful.  It hurts to encounter such rapid-fire economic ignorance, even if the barrage lasts for only two minutes.
[...]

By completely ignoring elasticity, Reich assumes his conclusion.  That is, he simply assumes that raising the minimum wage raises the total pay of unskilled workers (and, thereby, raises the total spending of such workers).  Yet whether or not raising the minimum wage has this effect is among the core issues in the debate over the merits of minimum-wage legislation.  Even if (contrary to fact) increased spending by unskilled workers were sufficient to bootstrap up the employment of such workers, raising the minimum wage might well reduce the total amount of money paid to unskilled workers and, thus, lower their spending.

So is employers’ demand for unskilled workers more likely to be elastic or inelastic?  The answer depends on how much the minimum wage is raised.  If it were raised by, say, only five percent, it might be inelastic, causing only a relatively few worker to lose their jobs and, thus, the total take-home pay of unskilled workers as a group to rise.  But Reich calls for an increase in the minimum wage of 107 percent!  It’s impossible to believe that more than doubling the minimum wage would not cause a huge negative response by employers.  Such an assumption – if it described reality – would mean that unskilled workers are today so underpaid (relative to their productivity) that their employers are reaping gigantic windfall profits off of such workers.  But the fact that we see increasing automation of low-skilled tasks, as well as continuing high rates of unemployment of teenagers and other unskilled workers, is solid evidence that the typical low-wage worker is not such a bountiful source of profit for his or her employer.
I usually have pretty good success (at least temporarily) with my liberal friends when I attack their love of things like living wage laws by introducing the idea of the marginal. The marginals are 1) the companies waiting to be born and looking hard at whether the numbers add up. 2) The companies on the cusp of failure and closing who are looking at how to make the numbers add up. 3) The companies looking to expand or hire one more employee and are looking at whether their labor will be worth the cost. And 4) companies looking to contract or lay off one employee and are looking at whether their labor is worth the cost.

It is among these companies that growth and contraction happens. These are often small, single location family businesses that have great hopes and tight budgets.

When I put it that way, sometimes the scales fall away from the eyes of my friends, and they admit that maybe the price of the law is greater than its benefits.

The problem is, as soon as our conversation is over, they tend to revert right back to their old thinking. The knowledge never seems to stick.

Employment

Today's employment report is one of the worst in a very long time.

The household survey showed an increase of only 16,000 jobs. The decline in the employment rate is almost entirely because 268,000 people have left the workforce--which is a huge number. The number of people looking for a job went up by 45,000.

In addition, on the employers' report, the previous two months were downgraded fairly seriously. Between June and July, the numbers were revised downwards by 48,000 combined.

Listening to NPR was interesting this morning, since they were trying to sell the household survey as good news.

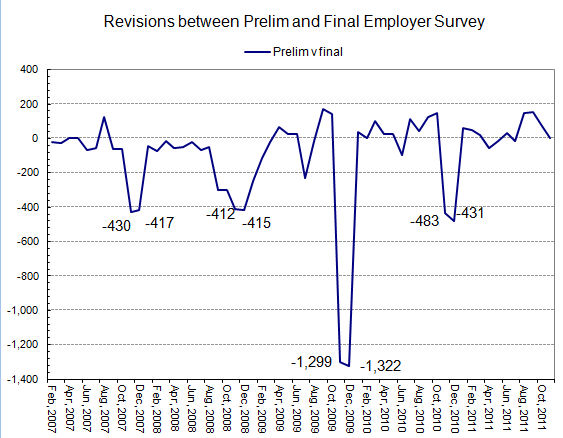
Update: Adding a graph of preliminary vs final numbers over the last 36 months, in order of the size of the revision (in response to: this on the NRO Corner)


Party like it's 2008

What's wrong with this headline?

Manpower hiring survey is most optimistic since 2008 - JSOnline

Here's a quote from the article:

The quarterly poll of employers' expectations compiled by Manpower Inc. found "the most promising hiring outlook" since the period that immediately preceded the financial meltdown of 2008, according to the Milwaukee-based global staffing services company

Spot the problem?

It's right here in blue and red, from my latest employment graph:


Yep, 2008 is the year when employment seriously tanked.

So, pop the champagne corks, we can party like it's 2008 again!!

Employment numbers

So, is today's unemployment report good news or bad news? The answer is neither of the above; it is actually irrelevant. The reason for this are two words: "Seasonally adjusted". The numbers that come out this month and next, the numbers that the media will all jump upon, will get revised next month and again the month after. Historically, November and December have large, very large downward revisions.

(Keep in mind that the Household survey, which is what they use to calculate the unemployment rate does not get revised. So the 8.6% number is already final.)

Last year, the initial job numbers were downgraded by 483,000 jobs by the time they were finalized. The 2009 numbers were downgraded a whopping 1,299,000 jobs. In 2008 it was revised by 412,000 downwards, and in 2007 it went down 430,000. So, the numbers that came out today will very likely be downgraded by at least 300,000, more likely by 400,000 or more. Combine the two and we are talking about the numbers between now and the end of the year probably being wrong by a combined 850,000 jobs.

The media, of course, rarely go back and correct the record. Here is a chart of monthly revisions. Novembers are unrevised, last month has had its first revision, and September's numbers are final. Here is a graph showing the size and direction of the revisions over the last few years:


So, taking into account that the numbers will likely be completely changed over the next two months, the how do the numbers look? We now have as many jobs (Household survey) in the country as we had in June, 2009...and February, 2005. In other words, there are no more jobs in the country today than there were almost 6 years ago. The Employer survey looks worse. We have the same number of jobs today as in May, 2009...and October, 2004. Celebrate!

Here's the graph showing a slow but steady increase in employment on both the Household and the Employment series:


So, we'll have the real November and December numbers solidified on the first Friday of March. Until then, take these with a big lump of pink Himalayan salt.

Do the work

Instapundit...

I was just discussing this very thing with the 11-year-old today:

Almost everyone I know started with crappy jobs like hauling shingles up a ladder, but if you’re not willing to do the crap work chances are you won’t make it that far. There are lots of jobs advertised but there are lots more that aren’t.

She mentioned that she and a friend were naming jobs they wouldn't want when they get older; she mentioned working in a fast-food restaurant. I pointed out that they were actually okay jobs; that they were good for an entry level; that often if you work hard at one, you can get promoted relatively quickly; that they often have reasonably good benefits; and that people want to know you can do the awful jobs before you can get a better one.

I also pointed out that it was a good second job when you were just starting out. I told her that you often have to take a job that doesn't pay enough when you begin. It might be in your dream line of work at your dream company, but you are still getting paid bupkis. You take it, hoping that you will get promoted and move towards the job you really want. In that case, you often need to work two jobs. So, don that polyester uniform and pay the rent!

Employment numbers

If it's the first Friday of the month...


What is there to say about today's employment numbers (which is more telling, in my opinion, that the unemployment rate):

1) The two surveys diverged slightly this month. The Employer survey (ES) (+117,000) showed improvement, the Household survey (HS) (-38,000) did not.

2) According to the HS, there are fewer jobs today than there were in: Jan-Jun of this year (in fact we are down 483,000 from May's high). There are also fewer jobs today than in: Sep 2010, Apr & May 2010, and any time between July 2004 and Aug 2009. That's right, there are the same number of jobs in the US as there were seven years ago.

3) The number of people "not in the labor force" has increased dramatically:
July 2010: 84,262
March 2011: 85,594
April 2011: 85,725
May 2011: 85,620
June 2011: 86,069 +449
July 2011: 86,443 +374K

Increase in people "not in the labor force" in the last two months: 823K--or, pushing 1 million people who've given up. And 2.181 million have given up in the last year.

4) The slope of the line on the ES is actually looking a little encouraging, though we have to wait for the revision. The final numbers came in for May this month, and they were revised down a small amount: 16K from their original release. So, it is possible that this incline might actually hold. We'll have to wait for next month to see, and we'll have to wait to see if the HS shows a similar improvement--so far, it doesn't.

Despite the improvement in the ES, the overall outlook continues to look grim.

Employment numbers

Nothing exciting. We seem to be holding onto the 1 million jobs created since the start of the year, but no new ones are showing up.

All gone

According to this on the BizJournal site, the upper midwest lost tons of jobs. Adding up the losses from: Minnesota, Wisconsin, Michigan, Ohio, Indiana and Illinois, the region lost 2,150,100 jobs in the last ten years.

Disclose this!

President Obama wants to make all companies seeking government contracts to disclose the political contributions from every single employee. Much has been said about how this would allow the government to pick political allies for contracts while shunning companies loaded with the other party.

Much less has been said about the chilling effect within each company.

How many people share the political views of their bosses and the owners of their company? How many people want their boss to have to compile a list of all of his employees' political contributions and have that sitting in front of him when it's time to decide on layoffs, promotions, and assignments?

I know I do not want my boss knowing my political persuasion, because it will automatically diminish me in his/her eyes. The thinking would be: How can you possibly believe and support that! I thought you were smart, like me!!! Now I find out your a stupid, idiotic, twit!

No thank you! Disclose is an abomination!

Employment April, 2011 (corrected)

So, here's this month's employment graph (click to embiggen):

Just to review, the shaded areas represent the time between elections, so Obama was elected in November, 2008. The vertical red and blue lines represent the swearing-in of the president in January of 2001 and 2009. The red blue series is the Household data. This is created by a telephone survey of real people. The blue red series is the Employer data, created by polling large employers. The unemployment rate is determined from the Household data.

Analysis: As you can see the two lines went in opposite directions this month. According to Employers, we've added almost a quarter of a million jobs last month. According to Households, we lost 190,000 jobs.

The line on NPR this morning looked at the Employer's data and said: We have lots of new jobs! When asked why the unemployment rate, now standing at 9%, went up, they looked at the Household data and the number of people who have entered or reentered the job pool, and said: More people looking means more unemployed. However this seems to me to be mixing apples and oranges. If you look at the Household number for the number of people looking for jobs, it seems to me you should also look at the Household number that says we lost close to 200K jobs this month. That's how the unemployment rate is calculated.

However, looking at the numbers, it appears that NPR pretty much flat-out lied. Remember, the question was: Why did the unemployment rate go up when jobs increased? and the answer was: Because more people entered and reentered the labor force. They also specifically said that it was actually a good sign, because more people looking, means a good mood change.

So what are the real numbers--which NPR never mentions?

March April Change
Civilian Labor force: 153,406 153,421 15,000
Employed: 139,864 139,674 -190,000

So, looking at those numbers, what would you attribute the increase in the unemployment rate? The 15K increase in the number of people looking for work? Or the 190K decrease in the number of jobs?

The left's beloved ratchet (Updated)

From Ron Radosh at Pajamas, discussing the left's infatuation with the Triangle Shirt Waist Fire story:
Look, for example, at the article by CUNY’s labor historian Joshua Freeman, writing in The Nation. Arguing that the fire took place “at a moment of radical challenge to the national structure of power,” Freeman sees an exactly parallel situation today. He writes:
“Today, as a cult of deregulation, a rabid ethos of unrestricted capitalism and the ability of firms to play workers in one country against those in another have seemingly sent us careening back in time toward a pre–New Deal regime of labor relations, there is less domestic opposition to sweated labor than 100 years ago (though low-paid workers overseas have been increasingly militant, evident in the fusillade of strikes in China). Periodic waves of moral outrage sweep across college campuses in antisweatshop campaigns, but as an organized force, labor has weakened to the point that the percentage of privately employed workers who belong to a union is now lower than in 1911.”


These people are basically whining that all of the consequences that the right has warned them about at every step in their push for more regulation and more state control really are real. It’s like they’ve had their fingers stuck in their ears for the last six decades and are now stomping up and down in a tantrum, because the consequences are finally too big to ignore.

They wanted more-regulated workplaces with unions around every corner, work rules, and benefits galore. The right warned that this would make manufacturing less efficient, increase the cost of labor, and reduce the number of US jobs. The left said, we don’t care, we want it anyway.

They wanted tighter environmental controls on business, driving up the costs of raw materials, energy, production, and delivery. The right warned that this would make domestic manufacturing prohibitively expensive, drive factories overseas, and reduce the number of US jobs. The left said, we don’t care, we want it anyway.

The left wanted higher taxes on business, to the point where the US has the highest corporate tax rates in the industrialized world. The right warned that this would place domestic companies at a disadvantage, force companies to open and incorporate elsewhere, and reduce the number of US jobs. The left said, we don’t care, we want it anyway.

The left wanted laws on corporate financial reporting so stringent, that CEO’s of private companies are afraid to grow their companies by going public, because they face the threat of federal prison if their financial statements don’t meet with government approval. Instead, they are incorporating overseas, or forgoing the capital infusions of going big and public and staying small and private. The right said that this will drive corporations to other countries, stifle domestic investment, and reduce the number of US jobs. The left said, we don’t care, we want it anyway.

The left wanted laws nearly-nationalizing healthcare insurance, eliminating reduced-coverage and reduced-price options for lower-skilled and lower-pay workers, forcing many companies to either report massive losses on their books (to great hue and cry from the left), to go on bended knee to beg the government for a waiver like a supplicant before a tyrant (my high school physics teacher often pointed out that the definition of tyrant is one who rules arbitrarily,) or to dump their employees’ insurance completely. The right warned this would reduce the number of people who could afford health insurance, increase the costs to business, increase the cost of labor, and thus reduce the number of US jobs. The left said, we don’t care, we want it anyway.

The left wanted more taxes to soak the rich. No one should be that rich, they said. We have the money in this country to do everything our little hearts desire; we just need to take it from those bastards! But those bastards don’t have a safe in the basement filled with gold. It’s invested in stocks, venture capital start-ups, real estate, and the economy. Every time taxes go up on the investor class, the right says this will cost the economy capital for investing in new businesses. Businesses won’t grow, new jobs won’t be created. The left said, we don’t care, we want it anyway.

We’ve had sixty years of the left not listening or caring what the consequences were. Sixty years of the left making it harder to do business and create jobs. We were rich enough to take the hit, they countered. Surely, we’re a rich-enough country to provide all of this. But each law, each tax, each regulation makes it harder and harder to employ people. Sooner or later, the weight of all of it forces a collapse.

What our government and the left must start doing every time a new law is proposed is to ask themselves: will this help marginal employers create jobs, or will it help to destroy jobs? In other words, what are the consequences of each turn of the tax and regulatory ratchet, because sooner or later, the ratchet drives the bolt home, and we’re all royally screwed.

Update: As if on cue, this article appears today from "Ray Buursma is a Laketown Township resident":
You are either stupid or lazy. Maybe both.

Now, I’m not referring to your work ethic or job performance. [...] I’m addressing the way you view economics and employment.
In light of what I wrote above, that's a promising start, right?
[...Y]ou continue to elect leaders who offer nothing but tax cuts, as if that would stem the flow of disappearing jobs.
You knew that was coming, right? Here's more:
Did you demand your leaders address America’s trade imbalance or continuous outsourcing of jobs? [Oh, lord!] Did you demand your leaders require foreign countries to buy a dollar’s worth of American goods for every dollar of goods they sell here? [Dude, we got a dollar's worth...in cold hard cash.]

[...] You made concessions to your employer and hoped that would stem the exodus of jobs, or at least yours.
He then goes on to praise unions to the sky. After a while, he lets off this whopper:
Does your company offer a pension plan, or do you now fund your own 401(k)?
Take an econ course, bonehead--either you fund your own retirement plan or you take the money from your kids after you retire. There is no other way. Where the h*&% does he think the money comes from? It comes from what a worker produces, that then gets sold, and the employer keeps part of it, and passes the rest to the employee in wages and benefits. Whether those benefits are a matching contribution to the 401K or some other program. The alternate is if you don't pay for your retirement out of your own productivity, but expect your employer to pay for you later. You get a nice big fat paycheck while you're working, but your kids get screwed, because the fixed benefit pension you enjoy is coming out of their pocket, not yours. Nice work if you can get it. Or does money fall from the sky?
I warned you I’d likely offend you, and I suspect I did. But once you overcome your anger, consider my analysis. Then, either wise up and do something about it, or resign yourself to a lower standard of living for the next decade.
I'm only angered by this guy's breathtaking stupidity.

Of course that's not all. I saw this article because two of my college friends linked to it on Facebook. College educated friends, of course. I reposted it as a form of bait. A junior high teacher of mine has since posted it as well--I don't know if she saw it from me or saw it on her own.

This is the world I grew up in and have lived in all my life, first in liberal Shorewood, Wisconsin; then at liberal Grinnell College; then in liberal Minneapolis; now in Los Angeles. Every single day supplies another reason to shake my head in dismay.

Decades-long tradition...not really

So, is the fight in Madison over some long-held, deeply-cherished cornerstone of decades of public union powers?

Not according to John Fund in the WSJ:
The governor's move is in reaction to a 2009 law implemented by the then-Democratic legislature that expanded public unions' collective-bargaining rights and lifted existing limits on teacher raises.
So, Walker is actually just trying to take back union powers that they've had for a whoppin' 2 years.

On the flip side, since they've only had these powers for two years, you can't really blame the collective bargaining rules for the deep doo-doo that Wisconsin is in.

On the other flip side (we're up to three) since the unions did not have this power from 1848 through 2009, they can't really make the point that removing them would be a catastrophe and lead to working conditions where there's a guy beating on a drum while another guy walks up and down with a lash.

Update: I tried to find some contemporary coverage of Fund's claims, and I couldn't really find anything. The closest was the extension of collective bargaining to various teachers at UW--including grad students. If you read his words carefully, this might be what he is talking about, but it is not the wholesale implementation that he seems to imply.

Entropy increases

"'Entropy increase,' as my old friend Huxley used to say, and I've never heard a truer word spoken." ~ Dr. Who (Tom Baker, I think in the episode "Logopolis", 1981)

---
"Second law of Thermodynamics: The second law of thermodynamics states that the efficiency of a heat engine is always less than 100% and that the entropy of a closed system must always increase."


Every time I think about the rallying cry that the economy will turn around once millions of "green jobs" start popping up, I think of entropy.

Basically, physics says that things will settle into the lowest energy state, and continue to decline--entropy increases. In order to get something into a higher energy state, you have to put in more energy than you will ever get out.

Economic energy flows into the most-efficient means of production. Successful companies maximize their outputs and minimize their inputs--becoming more efficient. Unsuccessful ones will go under and disappear.

The "green jobs" movement's claims go against the laws of thermodynamics. Basically, they say that companies will gladly sign onto what are currently--and will be for the foreseeable future--less-efficient and more-expensive means of production.

Until the green technologies evolve to the point that they offer better efficiency than current forms, adaptation simply can't happen without government force in the form of either laws or subsidies. In the absence of subsidies, the companies that adapt "green" technologies will pay a premium for doing so--will be inherently less efficient and will collapse in favor of more-efficient non-green competitors. If instead of subsidies, the government enacts laws, they then run into the problem that we don't live in a closed domestic market. Non-green competition from abroad would wipe out the less-efficient, but piously green, domestic companies.

But, in an open international marketplace, funding non-efficient technologies through subsidies puts your whole economy at a disadvantage against companies that allow companies to thrive on their own merits.

Companies will gladly adapt green technologies when it gives them a competitive advantage. They currently can not offer that, despite all the hype.

Employment Report

Oops, I don't think the employment numbers were supposed to look like this:

Minimum wage

Over on Carpe Diem, Mark Perry graphed teenage unemployment on the same graph as the minimum wage, but first, he subtracted the overall unemployment rate off of the teenage one--this gives, what he calls, "excess teen unemployment", or the increase in unemployment among teenagers above and beyond the general unemployment numbers.

It shows a tight correlation between the rise in the minimum wage and the teen unemployment rate:


From Carpe Diem:
"Bottom Line: As much as politicians and other advocates of the minimum wage might pretend otherwise, the laws of supply and demand (like the law of gravity) are NOT optional."

Employment

Here's the current graph of employment:


To explain my color scheme:
  • The shaded areas represent election day to election day, with Bush II in pink and Obama in blue.
  • The vertical line represent the official start of each president's term.
  • The blue line on the graph represents the household survey of employment
  • The red line is the employers' survey of employment.
Amazingly, the Household Survey for May showed a decline of 35,000 jobs. And this after I woke up to NPR crowing that this was going to be a fantastic jobs report. It looks to me like we're still bleeding.

The Employers Survey is more rosy, with a respectable increase of 431,000 jobs, YAY!!!...but there is a really big caveat: it includes government jobs. The increase in non-government jobs in May was: 41,000, very anemic.

Since the start of the year, and according to the Establishment Survey, employment has increased by 1,008,000 total jobs, with 480,000 of them government jobs and 528,000 private sector, or what we call "productive" jobs.

I've always put more trust in the Household Survey, because the Employers Survey just looks at big employers and doesn't capture small business at all. It shows and increase of 1,087,000 since the start of the year.

Another way to look at this, is that the HS shows that there have been no net jobs gained since July, 2004.

First Friday Employment Post

Here's the latest employment graph:


It looks like within a couple of months, the number of people employed will be less than at the depths of the post-911 recession--this despite an increase in population of about 11 million since 2003.

It also does not look like discouraged workers are beginning to look for work again. The numbers of long-term unemployed remained about the same, and the number out of the workforce has increased since last month.

If there is any bright side, it looks like the slope of the establishment survey line is beginning to shallow out slightly, though the household survey has not done the same. And both lines are still on a steep downward trajectory. A rough calculation of the average of the establishment line from October 2008 to July 2009 shows a monthly decline of about 0.593 million jobs lost per month. The same calculation over the last three months, July 2009 to October 2009, yields an average of about 0.136 million jobs lost per month--still a decline, but the slope is leveling off. The household data shows almost no change, if not a slight uptick in unemployment. The earlier period saw an average loss of 0.51 jobs per month, the most recent 3 months show a 0.59 jobs lost per month.

Economic recovery

I'd be very surprised if we were actually seeing the beginning of real growth in the economy, unless, of course, we are talking about a brief uptick followed by a second retreat. The reason is very simple:

Why would any employer of any size hire one additional worker in this climate?

Similarly, why would any prospective entrepreneur go out on a limb to start a new business in this climate?

Why would anyone take the risk of such things with so much uncertainty about the economic future and government mandates, regulations, and stupidity?

Employment analysis

In the Clinton-Bush recession we have household employment peaking in January, 2001 before dropping to a low in January, 2002. Employment started at 135,999 and dropped 1.9% to 133,468--2.5 million lost jobs.

Similarly, the employers' survey reported a high in May, 2001 and a low in August, 2003 - lasting substantially longer than the household survey: 13 months versus 27 months. The employment survey dropped 2.0% from a high of 132,453 to a low of 129,761--2.7 million lost jobs.

It then took an additional 17 months to recover back to it's original level--44 months overall. (It's hard to calculate the recovery of the household data, because of a major change to the methodology of the survey.

The current recession puts that one to shame.

High Household: Nov, 2007     146,703
Current Household:Sept, 2009     138,864
Difference:-5.3%-7.839 mil
   
High Establishment: Oct, 2007138,362
Current Establishment: Sep, 2009130,947
Difference: -5.4%-7,415 mil

Job losses in the two recessions: 2% vs 5.3%
Time to valley of employment (household): 13 months vs 23 months and counting.
Time to valley of employment (establishment): 27 months vs 24 months and counting.

Employment

Here's the latest graph of employment. It has dropped 5.2 million since Obama was elected, and 3.2 since he took office.